It has been almost 5 months that our Country is dealing with this pandemic. However, offlate the growth in Covid positive cases have been significant, and sometimes looking at the numbers might be a bit too scary! Nevertheless, a known devil is always better than an unknown angel! So, I have tried to jot down few basic parameters that I have been keeping a tab on. The numbers used are based on the data available on https://www.covid19india.org/
Basic figures that are being tracked by multiple agencies include number of tests, confirmed covid positive cases, active cases, recovered cases, and fatalities.
Then, based on these numbers, other data which is being tracked include:
- Confirmed Ratio (ratio of Covid positive confirmed cases out of total tests done)
- Active Ratio(ratio of currently active cases out of total confirmed cases)
- Recovery Rate (ratio of total recoveries against total confirmed cases)
- Mortality Rate (ratio of fatalities against total confirmed cases)
So first let’s start with a basic view of these trackers.
1. Number of Tests: Growth in number of tests being done on a weekly basis in the country has consistently been more than 18% since April-2020. The growth in number of tests was much higher during the earlier days owing to less number of tests! However, in regards with growth in number of tests, July recorded minimal growth. For entire July growth in tests was about 18-19% on a weekly basis, which has already increased to about 22% in August! A comparative view of growth rate of few states/ UTs is provided below:
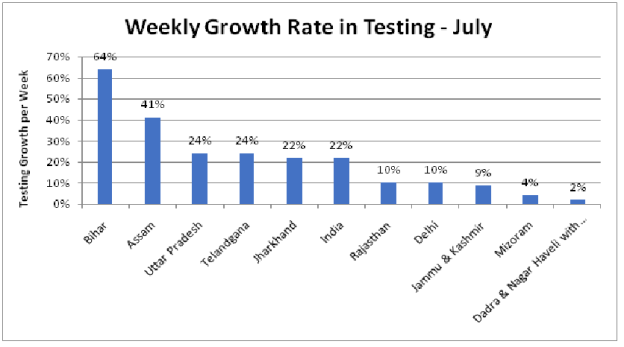
However, it is worth noting, that test growth rate of Pune, Chennai, Thane and Bangalore are also at 28%, 25%, 24% and 22% as on 08/08/2020.
2. Confirmed Cases: Confirmed cases in India have grown at a much higher rate. Minimum growth rate observed in past 16 weeks was 23% and that too in the week ended on 08/08/2020! Although, growth rate of confirmed cases has reduced to 23% from as high as 52% in second week of May, but it still is not a reason to rejoice given the fact that we are already sitting at a huge number of 21.57 lakh cases, which implies that even a meagre growth of 10% would mean more than 2 lakh new cases per week! Further, another reason for concern is that the growth rate in testing is still lower than growth rate of Confirmed cases. Crudely put, the Covid-19 virus is still outrunning our efforts to contain it!Minimum and maximum CAGRs witnessed by few states in last 4 weeks along with India’s CAGR are detailed below:
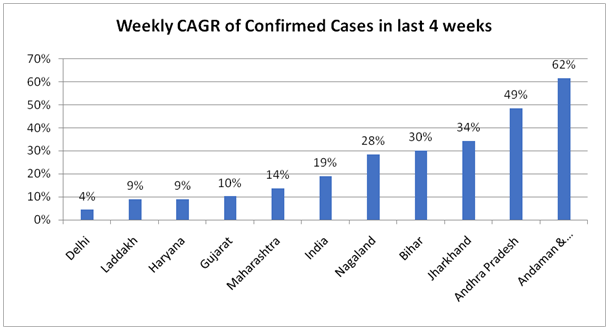
Sad thing to notice here is that, now the virus is spreading quite rapidly in non metro areas as well!
3. Confirmed Ratio: There is a dual significance of this ratio. First, lower ratio implies that number of tests being conducted are effectively capturing the actual outbreak in the region. Secondly, a decline in ratio over time signifies improvement either in restricting the outbreak or in accelerating the testing efforts.
The ratio has been continuously deteriorating for the Country. The ratio was at a minimum of almost 3.82% in May starting, which has now deteriorated to 8.95% as on 08/08/2020!
5 states with highest (worst) confirmed ratio as on August 08, 2020 vis-à-vis worst position witnessed by them is detailed below:
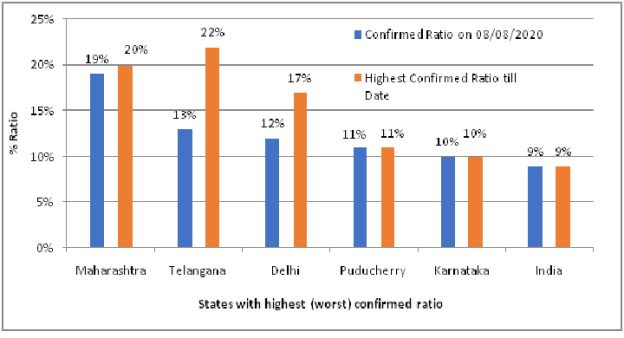
Except Puducherry and Karnataka, all these states/UTs have started witnessing decline in the ratio.
States which have managed to contain the confirmed ratio to upto 3% are Arunachal Pradesh, Himachal Pradesh, Meghalaya, Mizoram, Sikkhim, Rajasthan, Tripura, Chhattisgarh, Kerala, Jammu & Kashmir, and Punjab! Out of these states, except Meghalaya, Mizoram and Sikkim, all states have conducted more than 1 lakh tests!
States/ UTs which are already past their worst confirmed ratio as on 08.08.2020 are Maharashtra, Telangana, Delhi, Bihar, Ladakh, Gujarat, Assam, Madhya Pradesh, Punjab, and Mizoram.
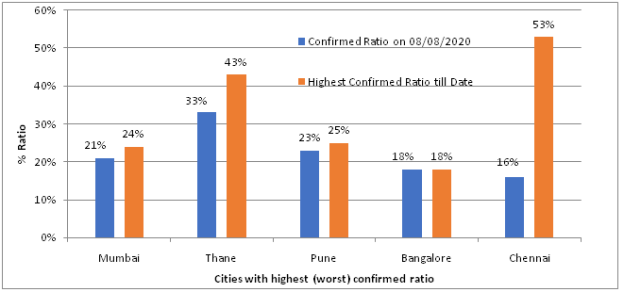
Among worst hit cities, a view of Confirmed ratio as on 08/08/2020 vis-à-vis their worst confirmed ratios since 18/07/2020 are detailed below:
4. Active Cases: In India, total active cases have been growing at an average growth rate of 26%, which has reduced to about 11% in last week ended 08.08.2020! Thankfully, growth rate of active cases has been negative for Jammu & Kashmir, Tamil Nadu, Dadar & Nagar Haveli and Daman & Diu, Arunachal Pradesh, Maharashtra and Meghalaya! Further, among the cities most infected by the virus, Mumbai, Thane and Chennai, all have witnessed negative growth rate in last three weeks! Worst (maximum) growth has been observed in the states of Andaman & Nicobar, Assam, Manipur, Nagaland, Mizoram and Bihar! Top 5 active states with highest cases are still Maharashtra, Andhra Pradesh, Karnataka, Tamil Nadu & Uttar Pradesh.
5. Active Ratio: This ratio depicts active cases as on date vis-à-vis cumulative confirmed cases till date. Personally, I feel, only significance of the ratio is to depict the level of outbreak as on date. Higher the ratio, it depicts that Covid outbreak in the state is quite recent, however, lower active ratio might be on account of high recovery ratio or high mortality ratio. States having Active ratio of more than 50% as on 08/08/2020 are Nagaland, Andaman & Nicobar, Meghalaya, Jharkhand, Sikkim, and Mizoram depicting that the outbreak in these states is quite recent! Among these states, Andaman & Nicobar, Nagaland, and Jharkhand have among the highest growth rates in confirmed cases as detailed above.
6. Recovered Ratio: Total recovery ratio for the country has increased to 69%. Top-6 and Bottom-6 states/ UTs in this aspect are highlighted below:
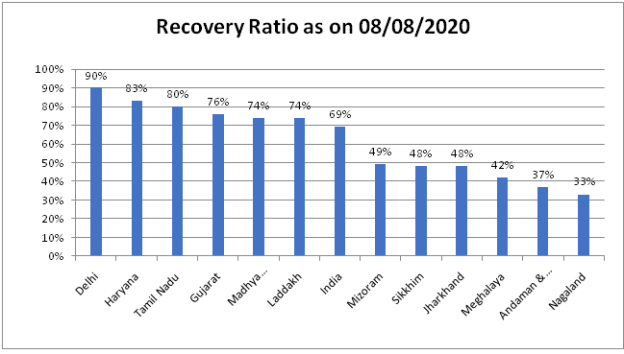
Among the worst affected cities, Chennai’s Recovery ratio is most promising (after Delhi) as on date at 87%, followed by Mumbai (78%) and Thane (75%). Lower recovery ratio is almost in line with higher Active Ratio!
7. Mortality Ratio: World average of Mortality ratio due to Covid 19 stands at about 3.70%, which, for India is 2.02%. Highest mortality ratio for India was on May 05, 2020 at 3.43%. Significant decline in this ratio can be attributed to constant efforts of healthcare workers. Another significant reason could be outbreak of Covid-19 in non metro areas, where people are presumed to have better immunity as compared to people in metro cities. States having mortality ratio higher than country average are detailed below:
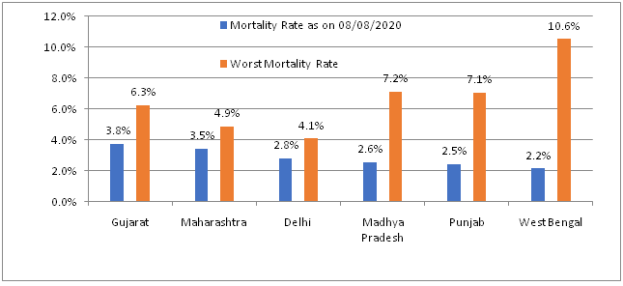
Mortality rates in Karnataka, Tamil Nadu, and Andhra Pradesh, which are among 5 most infected states along with Maharashtra and Delhi, are significantly lower at 1.80%, 1.65%, and 0.89% respectively. Mortality ratios have been continually declining on a weekly basis for past 7 weeks for the states of Delhi, Gujarat, Haryana, Kerala, Madhya Pradesh, Maharashtra, Rajasthan, Telangana, Uttar Pradesh, and West Bengal.
On the contrary, mortality ratios have worsened in last 4 weeks for the states of Jammu & Kashmir, Puducherry, Andaman & Nicobar, Goa, Chhattisgarh, Tripura &Ladakh.
These are the basic numbers which are generally being used to track the outbreak of pandemic in the country. A trend which can be made out from this data can be summarized as:
- The pandemic is now spreading to non metro centers as well.
- Growth in Covid positive cases is still at a higher rate compared to growth in testing
- States/ UTs of Andaman & Nicobar, followed by Mizoram, Nagaland, and Jharkhand urgently need to take drastic steps to deal with the worsening situation.
- Delhi and Maharashtra’s numbers have improved when compared to its levels one month back, however when compared to other states, the numbers still look alarming.
- Situation of states/UTs of Jammu & Kashmir, Bihar, Puducherry, Assam, Meghalaya &Sikkhim presently appears manageable, however, looking at the speed of outbreak in these states/UTs, lack of preventive measures can prove quite detrimental.
- Although, numbers have increased significantly in states of Andhra Pradesh and Karnataka, but these states have managed to keep a tab on other parameters.
There are still a large number of parameters, which when considered might give an entirely different view, since some of the assumptions in above analysis include an even outbreak in entire state. Further, based on the numbers/ ratios discussed above, it is still a bit difficult to do a predictive analysis, however, I will try to work on a predictive analysis in my next post.
